
PublishPlot
Numerically Differentiating a Plot
Description
A common need in experimental science is to differentiate curves to find their slope as a function of the x-axis variable. Numerical differentiation can be challenging and often needs smoothing to get good results. This scripts offers one option based on linear fits to blocks of data.
Script Downloads
| Script Name | Installation Steps | Date |
|---|---|---|
| Differentiate Plot |
|
1 Apr 2023 |
Version history:
- Version 1: 4 April 2021
- Version 2: 30 July 2021 - revised method to access AppleScript lists that resulted in 200X speed up in calculations for plots with many data points (see script comments for details).
- Version 3: 2 Apr 2023 - use AppleScript referencing for improved speed.
Numerical Differentiation Challenges
For perfect curves (i.e., noise-free data), one can find their derivatives point-by-point using
di = (yi+1-yi)/(xi+1-xi)
where di is the derivative for x = (xi+1+xi)/2. But this equation also explains the difficulty of working with real data having noise. Imagine running experiments where y data are measured with 1% accuracy. The calculation of the difference needed for di when y is around 100 might be:
yi+1-yi = (100±1) - (99±1) = 1±2
In other words, data with 1% accuracy can results to differences needed for differentiation with 200% errors. It is the age-old problem of measuring the difference between two similar numbers.
The best approach to numerically differentiating real data is to use some smoothing. The strategy used in the "Differentiate Plot" script is:
- Divide the x range for the plotted data into n intervals. Each interval should have more than 2 points and preferably 4 or more points.
- Partition all y data points into the n boxes.
- For each box, fit the data to a line and find its slope. This slope is tangent to the curve at the mean value of the data points in the box. In other words it is the derivative of the function.
Using the "Differentiate Plot" Script
To differentiate any curve, select it and choose "Differentiate Plot" from the "Scripts" menu (if don't select a plot, the front one is differentiated). You will be asked to select the number of boxes (and be told how many points were found). You should pick the number of boxes based on number of points and on variability of the data. The number is initialized to have about 4 points per box, but fewer boxes (or more points per box) is often better. If desired, you can enter 0 to use point-by-point differentiation (but the results will likely not be very good unless the data is perfect). When you click OK, the derivative will be calculated and plotted as a dashed line using the same color as the original plot.
The following two figures show an example. The plot on the left has experimental results for total energy released by a propagating crack as a function of the amount of crack growth. These data are relatively noise free, but still need smoothing for good differentiation. The plot on the right shows differentiation of energy, which leads to a property called the "energy release rate" for crack growth. It was found by using the "Differentiate Plot" script and choosing 20 intervals. The lines in the left plot show the twenty intervals. Each interval was fit to a line (each one had about 12 points in these data) and the slopes gave the derivative. As expected, the derivative starts low, gradually increases, and then plateaus in the region where the data became a straight line (although some noise remains).
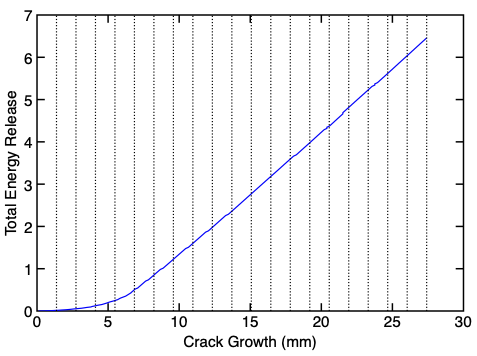
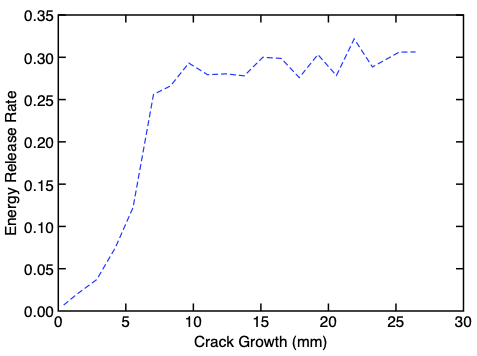
You can click to enlarge these example plots in another tab or window.
Handling Very Noisy Data
If your data is particularly noisy, you might need more smoothing than provided by the "Differentiate Plot" script. One option in PublishPlot is to:
- Select data and open inspector window to the "Data" tab.
- Click to transform "Y" data, select "fit," and choose "Spline Smoothing" from the menu.
- Enter a number of knots in the "k" field. The best number will depend on your data and might need experimentation. Start with about 5 and then click "Transform".
- A new "smoothed curve" will appear on top of the original data. Select this new curve and run the "Differentiate Plot" script.
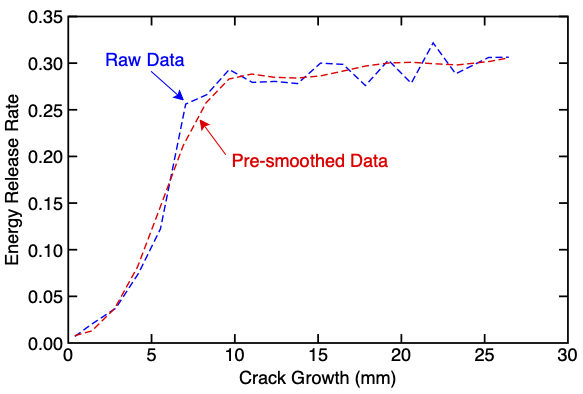
The following figure compares output of using this smoothing option to the non-smoothed method in the example above. The results are similar, but using pre-smoothed data has less noise in the final derivative curve.
A new option in PublishPlot 2.6 is do do exponential smoothing instead of spline smoothing. You enter a smoothing value in the "k" field between 0 and 1 where smaller numbers give more smoothing. Exponential smoothing works best with equally spaced points having random noise.
By combining smoothing with the "Differentiate Plot" script, you should be able to differentiate a wide range of data sets, included rather noisy data sets.