
PublishPlot
PublishPlot Description
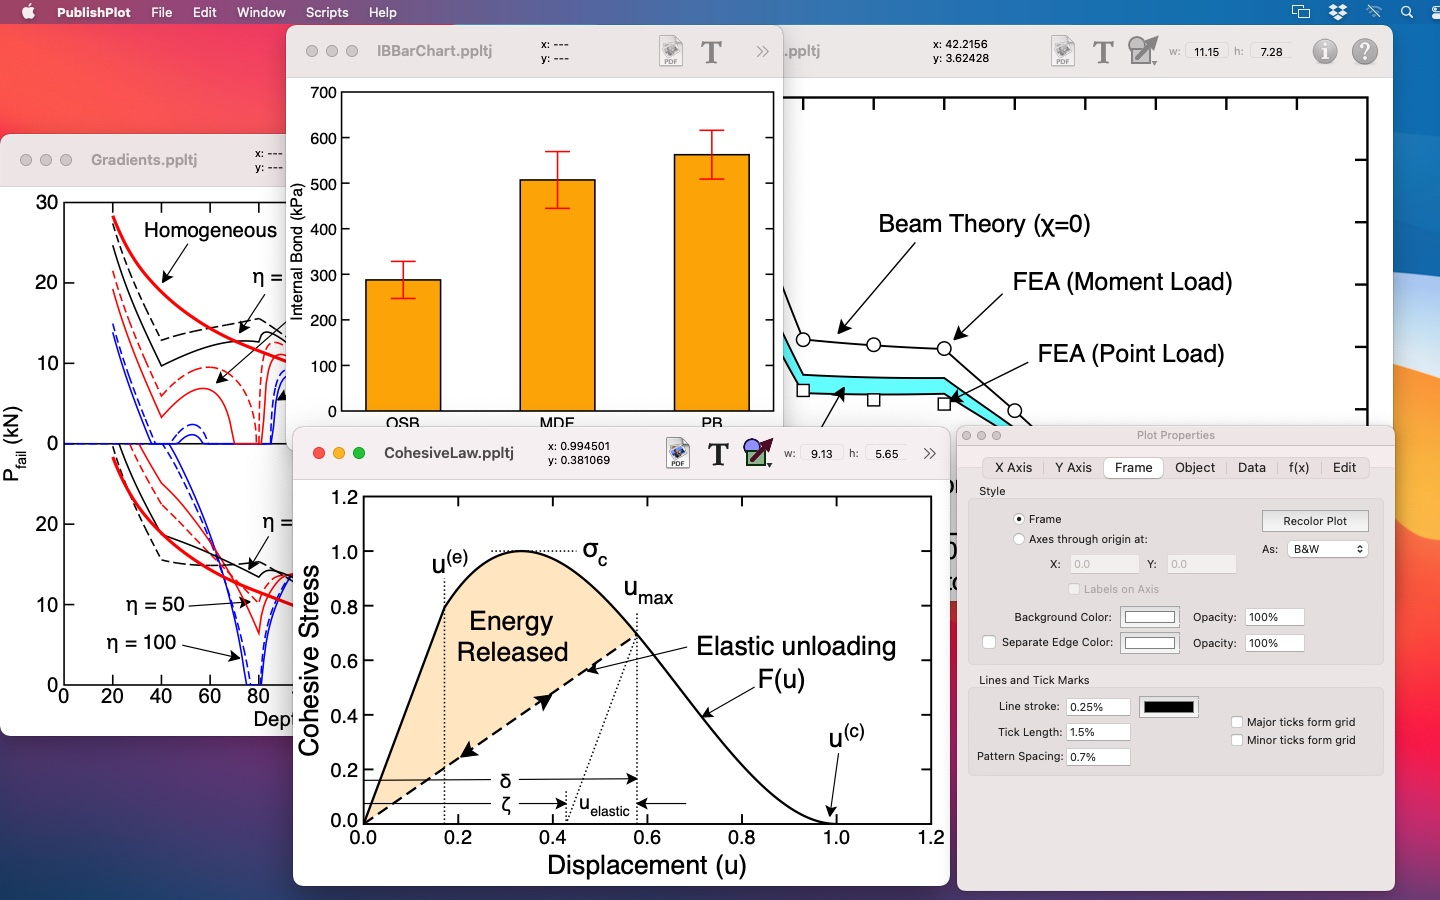
PublishPlot is a Mac application by the author of GEDitCOM II, who is also a professor and former editor of an international scientific journal. The purpose of PublishPlot is to turn any collection of data (in flexible plain-text formats) into a publication-quality plot and to do that as quickly as possible. You can see many examples of published, PublishPlot graphics in papers by the author (since 2006) and in a few samples below.
As an editor, the author of PublishPlot frequently had to reject or request mandatory revisions from authors who submitted sub-standard plots for publication. Perhaps the worst offenders were those who copied and pasted default plots from Microsoft Excel. Those plots have horrible graphics design. Although it is possible to change every feature of Excel plots, you have to changed virtually every one to get acceptable results. Why not start with decent graphics in the first place? PublishPlot tries to do just that.
PublishPlot Features
- Quickly convert any table of data into a plot
- Customize all features of the plot
- Easily scale the plot to any size while conserving relative sizes of all plot features (see below for more)
- Annotate plots with labels, arrows, and shapes
- Add error bars
- For collections of experimental data points, calculate means, standard deviations, and quartiles and then re-plot the results with standard deviation error bars, box & whisker graphics, or violin plot graphics. The latter two can be with or without outliers.
- Do simple data transformations including fits, spline interpolations, and smoothing
- Plot arbitrary functions of x
- Edit data in PublishPlot by simple plain-text editing methods
- Export a plot to a
- Create and transform plots using AppleScripts run from a "Scripts" menu (you can download ready to use scripts from this web site).
Graphics Design Feature: A unique feature of PublishPlot is that you never set absolute size of plot elements. Instead, all plot features are sized relative to the size of the plot. This approach mimics the way illustrators used to draft plots before using computers. For example, one design rule-of-thumb was to have plot symbols be 1-2% of the plot diagonal. Similarly in PublishPlot, all size settings are done as a percent of the plot diagonal. Even when setting font sizes in points, you are really setting a "virtual" font size that gives the actual size for a full-page, landscape-mode plot (i.e. about a 10 inch diagonal), but scales it for other plot sizes. This approach allows you to easily resize your plots to fit your publication needs.
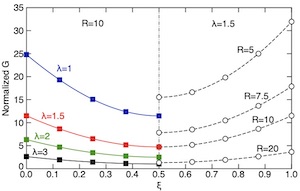
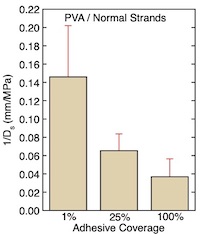
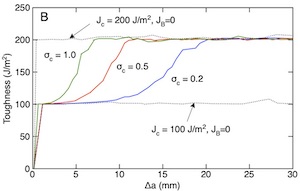
Some Sample Plots
Click to enlarge these sample plots in another window:
Buy Me — Purchasing PublishPlot
PublishPlot is available in the Map App store. The current version is 3.3.1 (as of January 2026).
Contact
Author: John A. Nairn
Email: john@geditcom.com
Privacy Policy
Other software by the same author:
- GEDitCOM II — Genealogy software for the Macintosh
- Date Calculator — Date calculations for genealogists
- Computational Mechanics Software — material point method (MPM) and finite element analysis (FEA) software